This week I mentioned the Democratic–supporting “blue states” and Republican-supporting “red states.” The map makes it very clear which regions are which:
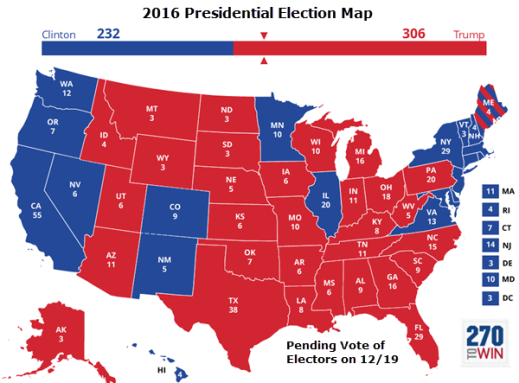
The map shows the numbers of electors (in the Electoral College) for each state; you need 270 electoral votes to win.
Here are the results for the 2012 election, when Barack Obama beat Mitt Romney to win reelection:
Similar results to 2016, but some key states (Pennsylvania, Ohio, Michigan) made a big difference.
The popular vote is somewhat different from the Electoral College vote, though. Here’s a map that shows the votes by county, not state, with the county sizes altered to show their population.
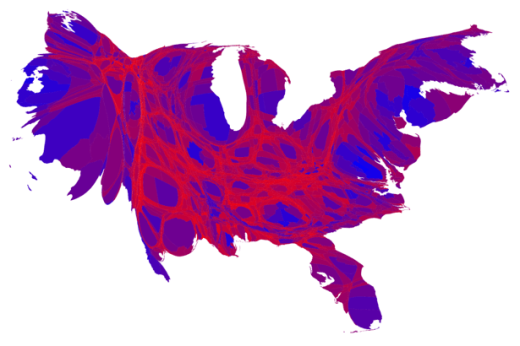
On the West Coast, you can see that Los Angeles, San Francisco, and Seattle are big spots of blue; on the East Coast, the same is true for Miami, Washington DC, and New York. This map explains why Hillary Clinton can come out ahead in the popular vote while still not getting the numbers in the Electoral College that she needs to win.
Even in a state like California, which chose Clinton (8.6 million votes) over Trump (4.4 million votes), the map is more complicated. This map shows the Democratic (blue) vs. Republican (red) composition in the state assembly (州議会).
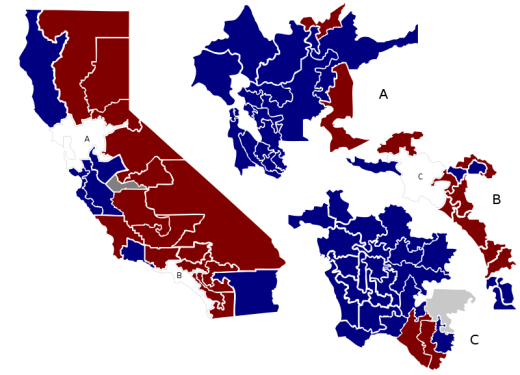
Section A is the Bay Area, San Francisco and its surrounding areas. Section B is southern California from San Diego on the Mexican border up through Ventura on the coast north of Los Angeles. And section C is the central part of Los Angeles. There’s a lot of red on the map, but the red sections are very big, which means not many people live there. (The biggest red section, on the Nevada border, includes places like Death Valley and a lot of mountains more than 4,000 meters high. Nobody wants to be in places like that!)


